Performance Engineering End-to-End: From TTFB to Tail Latency
Performance isn’t a tuning phase — it’s an architecture property. This month I lay out an end-to-end mental model (browser → edge → app → data) and the practical playbook for improving both “fast on average” and “fast under load” without shipping fragile optimizations.
Axel Domingues
Most teams treat performance like this:
- Build features
- Ship
- Panic about “slow”
- Sprinkle caches and pray
That’s not performance engineering.
That’s performance debt collection.
This month is about a different posture:
Performance is an end-to-end architecture property — and the “end-to-end” part is the trap.
Because your users don’t experience “the backend” or “the frontend”.
They experience the critical path from click → pixels → interaction → trust.
And the brutal part is:
- improving the average is often easy
- improving the tail is where systems reveal their real design
Performance is the sum of that path — plus the queueing you created along the way.Browser → Edge/CDN → Load balancer → App → Dependencies → Data → Back again.
The goal this month
Build a practical end-to-end performance model: measure → attribute → fix → validate.
The core shift
Stop optimizing components in isolation. Optimize the critical path and the tails.
What “good” looks like
Fast for real users, fast under load, and changes don’t regress silently.
The secret weapon
Budgets + guardrails (CI, dashboards, alerts) so performance stays a property, not a hero project.
The End-to-End Performance Stack (A Useful Map)
When a page feels slow, the question is not “where is the bottleneck?”
The question is:
Where is time being spent on the critical path, and why does it get worse at p95/p99?
Here’s the map I use. It’s not perfect, but it’s actionable.
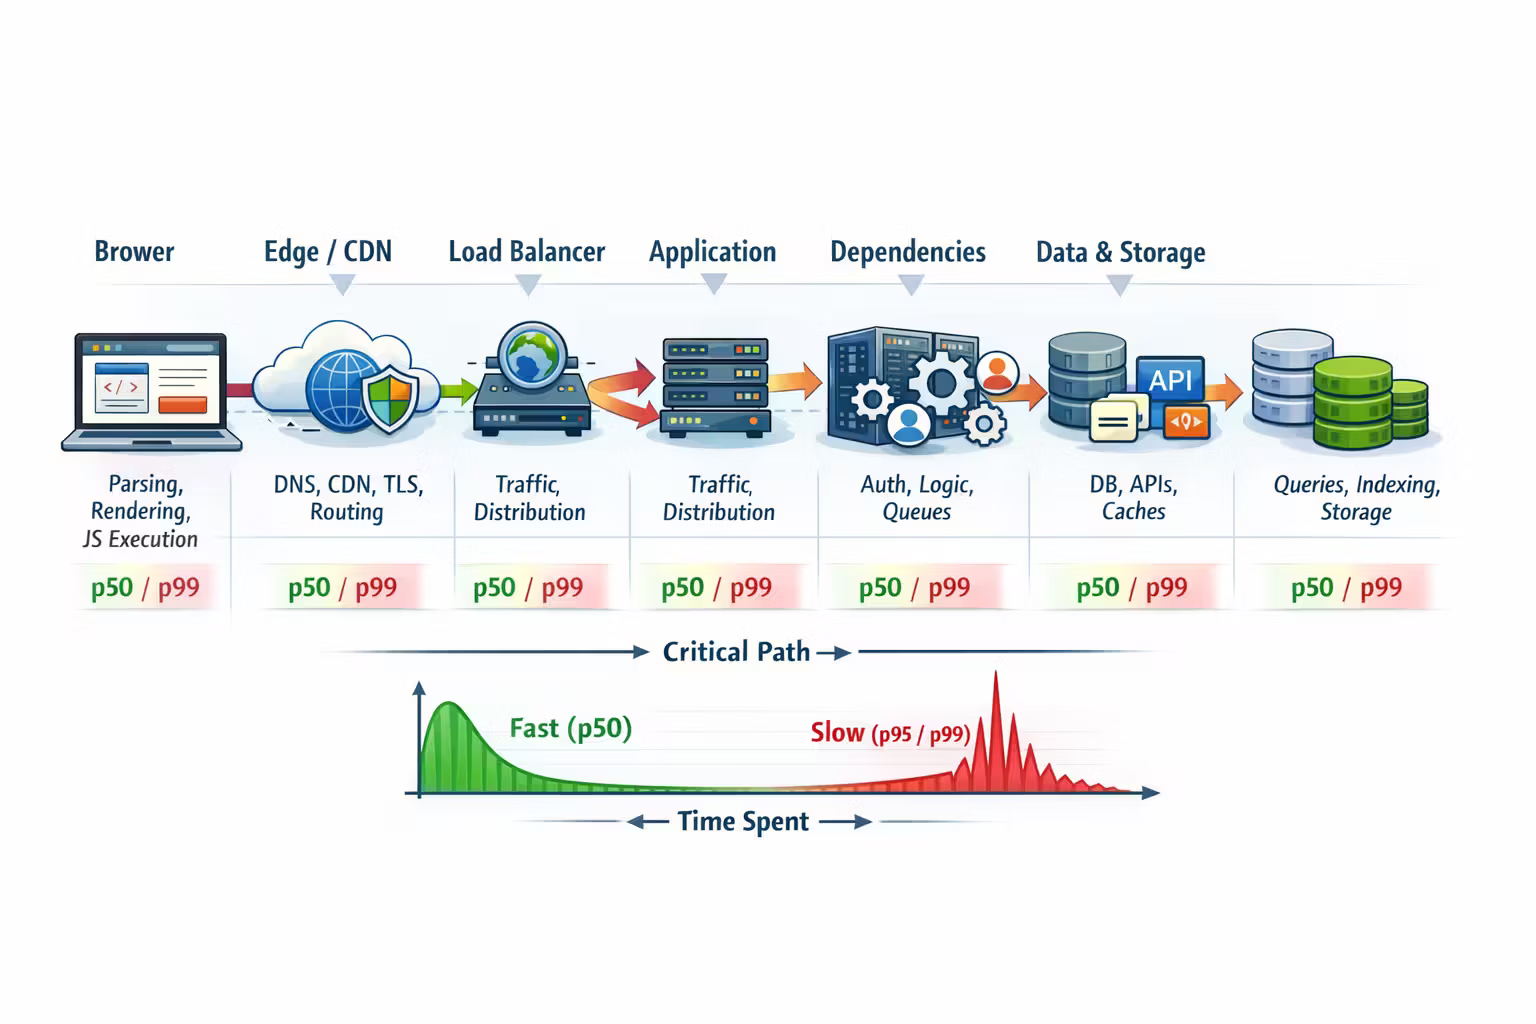
The main segments
- Browser work
- HTML parsing, JS execution, hydration, rendering, main-thread contention
- Network + edge
- DNS/TLS, CDN cache hits, compression, connection reuse, routing
- Backend request path
- auth, routing, serialization, thread pools/event loops, contention
- Dependencies
- DB queries, caches, queues, third-party APIs, service-to-service hops
- Data & storage
- index usage, lock contention, slow queries, write amplification, cold pages
You can “feel” that something is slow — but you can only fix what you can locate on the path.Don’t optimize what you can’t attribute.
Metrics That Matter (And the Lies They Tell)
Performance metrics are like financial metrics: easy to game, easy to misread.
Frontend user experience metrics (what people feel)
- TTFB (Time To First Byte): “how quickly did the server start responding?”
- LCP (Largest Contentful Paint): “when did the page look meaningfully loaded?”
- INP (Interaction to Next Paint) / responsiveness: “does it feel interactive?”
- CLS: “does it jump around while loading?”
Backend service metrics (what systems do)
- Latency distribution: p50, p90, p95, p99 (not just average)
- Throughput: requests per second, jobs per minute, etc.
- Errors + retries: the silent killers of tails
- Saturation signals: CPU, memory, I/O, connection pools, queues
If your p50 is great and your p99 is awful, your users will still tell you “it’s slow” — because the tail is where trust dies.
TTFB vs Tail Latency: Two Different Problems
TTFB is often “path length”
TTFB usually improves when you reduce:
- hops (too many services)
- cold starts
- expensive authentication / policy checks
- synchronous dependency calls
- payload serialization overhead
Think of TTFB as:
“How quickly can the system produce the first byte when it’s not stuck waiting in line?”
Tail latency is usually “queueing + contention + retries”
Tail latency usually explodes when you introduce:
- shared resources (DB, caches, connection pools)
- lock contention
- GC pauses / memory pressure
- noisy neighbors (multi-tenancy, shared clusters)
- retry storms (client retries turning into load multipliers)
- thundering herds (cache expiry, fan-out calls)
Think of tail latency as:
“What happens when the system is under pressure, and variance becomes your enemy?”
- add a cache with low hit rate → adds latency on misses
- add retries “for reliability” → creates retry storms under partial outages
The Performance Pyramid (Where to Spend Your Time)
Not all optimizations are equal.
Here’s the order I like — because it produces stable wins.
- remove unnecessary service hops
- avoid synchronous fan-out to multiple dependencies
- ensure payloads are lean (avoid sending “everything”)
- move heavy work off the critical path (async, precompute, background jobs)
- CDN caching for static assets and public content
- server-side caching for expensive reads
- correct cache keys + correct invalidation strategy
- avoid stampedes (jitter, request coalescing, early refresh)
- eliminate N+1 queries
- add or adjust indexes based on real query patterns
- fix hot partitions / hotspots
- make writes cheaper (batching, idempotency, async)
- faster JSON serialization
- faster regex parsing
- tight loops / allocations
- language/runtime tuning
This is the reason “performance experts” start with architecture, not flame graphs:
Most systems are slow because of shape, not because of a slow for loop.
A Practical Playbook: Measure → Attribute → Fix → Validate
I use the same loop for almost every performance project.
Define what “good” means (in numbers)
Pick targets that reflect user experience:
- page-level: LCP, INP, TTFB
- service-level: p95 latency per endpoint, error rate, saturation ceilings
- and define “no regressions” (budgets in CI)
Capture the latency breakdown
You want a breakdown like:
- frontend: JS execution, render, network
- backend: time in app vs time waiting on dependencies
- dependency: DB query time, cache hit/miss, third-party time
Use correlation IDs across logs/traces so “one request” stays one story.
Fix the biggest contributor on the critical path
Pick one:
- remove a hop
- remove a sync dependency
- cache or precompute
- reduce payload / response size
- fix the slow query / missing index
Validate with real traffic patterns
Test in a way that matches reality:
- warm vs cold caches
- a mix of endpoints (not just one)
- concurrency levels you actually see
- failure modes (slow DB, partial outage, retry behavior)
Add guardrails so it stays fixed
If the improvement isn’t guarded, it’s temporary.
- dashboards + alerts on p95/p99
- performance budgets in CI
- load test on critical flows in your release pipeline
The “User Journey” Lens: Performance Isn’t One Endpoint
Most meaningful slowdowns happen on flows, not single calls.
A checkout flow might be:
- load catalog
- add to cart
- price calculation
- payment intent
- confirm order
- send email
If each step is “acceptable”, the flow can still feel slow.
So I prefer this split:
Endpoint health
Latency and errors per API, per dependency, per region.
Journey health
Time across multi-step flows (critical business transactions).
A performance culture measures both.
Because your users live in journeys.
A Few High-Leverage Techniques (That Don’t Age Badly)
1) Reduce payloads aggressively
- Trim response fields (don’t ship internal “everything” objects)
- Use pagination and “include=…” expansions intentionally
- Compress responses (gzip/brotli) and avoid huge JSON blobs
Why it works: less network, less parsing, less memory, less time everywhere.
2) Make expensive work asynchronous (without lying)
- Move non-critical side effects off the request path
- Use outbox + idempotent consumers for reliability
- Return quickly with a stable state transition
Why it works: your p95/p99 stop paying for background work.
3) Cache at the edge when possible
- CDN cache static assets
- Cache public content pages
- Use stale-while-revalidate patterns where correctness allows
Why it works: edge caching removes entire backend hops from the path.
4) Control fan-out
The classic tail-latency killer is “call 6 services in parallel”.
Even if each is “fast enough”, the combined result is gated by the slowest.
Mitigations:
- remove calls from the critical path
- combine data behind a single boundary
- batch requests
- degrade gracefully (show partial content)
5) Tame retries
Retries are not free.
Guardrails:
- use timeouts with intent (shorter than your SLO budget)
- jitter backoff
- circuit breakers
- cap retries
- avoid retrying non-idempotent operations unless you have idempotency keys
Tail Latency: Where Architecture Gets Honest
If you want a mature performance practice, this is the line you cross:
You optimize not for “fast when idle”, but for “predictable under load”.
That means learning to love:
- queue depth metrics
- saturation dashboards
- p99 per dependency
- “how many concurrent requests can we handle without collapse?”
The biggest tail-latency traps I see
Symptoms:
- latency increases with traffic
- errors rise late
- p99 explodes
Fix:
- right-size pools
- reduce chatty calls
- shard hotspots
- add caching / precompute
- isolate workloads
Symptoms:
- one slow request makes others wait
- single-threaded bottlenecks (or saturated worker pools)
Fix:
- separate queues/pools by class (fast vs slow)
- impose timeouts and budgets
- avoid synchronized locks on hot paths
Symptoms:
- partial outage turns into total outage
- traffic spikes during failures
Fix:
- exponential backoff + jitter
- circuit breakers
- fail fast with graceful degradation
- make operations idempotent (so retries don’t duplicate money)
Symptoms:
- periodic p99 spikes (often correlated with TTL boundaries)
- sudden DB pressure
Fix:
- add jitter to TTLs
- request coalescing
- stale-while-revalidate
- pre-warm critical keys
Performance Budgets: The Architectural Guardrail Most Teams Skip
Budgets are the difference between “we fixed it once” and “we stay fast”.
Examples:
- page: LCP must stay under X seconds on median devices
- API: p95 under Y ms for critical endpoints
- payload: response size under Z KB for mobile flows
- DB: query must stay under N ms for hot paths
- “Is this extra field worth 30ms on mobile?”
- “Do we need this additional dependency call?”
- “Should this be async?”
Where budgets live:
- CI checks (Lighthouse/Playwright, API perf tests, payload size checks)
- dashboards and alerts
- release gates for your critical flows
Resources
FAQ
Start where the user pain is measurable.
If LCP/INP is bad, start with:
- payload size
- JS execution/hydration cost
- render-blocking resources
- edge caching
If TTFB and API latency are bad, start with:
- request path shape
- dependency breakdown
- slow queries and fan-out
- tail latency drivers (queueing, retries)
If you care about p95/p99, yes — because tails often appear only under pressure.
But you don’t need a heroic “load test project.” Start with a small, repeatable test on your top flows and run it on every release.
Treating performance fixes as one-off hero work.
Without budgets and guardrails, regressions are inevitable. A fast system stays fast because it’s defended by process, not memory.
What’s Next
This month was about performance as an end-to-end discipline:
- the critical path
- the difference between p50 and p99
- how queueing, retries, and fan-out create tails
- and why budgets are architecture, not bureaucracy
Next month we go up a layer:
Cloud Infrastructure Without the Fanaticism
Because most performance discussions get stuck at “tune the app”…
…when the platform choices you made are often the largest constraint on latency, reliability, and cost.
Cloud Infrastructure Without the Fanaticism: IaaS, PaaS, Serverless, Kubernetes
A practical mental model for choosing cloud primitives without ideology—based on responsibility boundaries, scaling, reliability, cost, and team operating capacity.
API Evolution at Scale: Compatibility, Contracts, and Consumer-Driven Testing
APIs don’t fail because they’re slow — they fail because they change. This month is about designing contracts you can evolve, enforcing compatibility automatically, and scaling teams without “everyone upgrade on Tuesday.”