Observability that Works: Logs, Metrics, Traces, and SLO Thinking
Observability isn’t “add dashboards.” It’s designing feedback loops you can trust: signals that answer real questions, alerts tied to user pain, and tooling that helps you debug under pressure.
Axel Domingues
When teams say “we need observability,” they often mean:
- “We got paged and didn’t know why.”
- “We shipped and something got slower.”
- “Customers are complaining, and we can’t reproduce it.”
And the most common “solution” is… buying tools and creating dashboards.
That’s not observability.
That’s new screens to be confused by.
Real observability is a discipline:
Design the signals that let you detect, explain, and fix production behavior fast — without guessing.
In 2022, this matters because systems aren’t simple anymore:
- one request fans out into many services
- the “bug” might be a dependency or a rollout
- and most failures are partial (some users, some regions, some endpoints)
So this month is about a practical, non-folklore mental model:
Logs + Metrics + Traces are not “three tools.”
They’re three signal types that answer different questions — and SLOs decide which questions matter.
Monitoring tells you something is wrong.
Observability helps you ask “why is it wrong?” without shipping new code first.
What you’re building
A feedback system: signals → decisions → fixes → learning.
The failure mode to avoid
Dashboard theater: lots of graphs, no answers under stress.
The architect’s question
What must we know to operate this system safely?
The outcome metric
Mean time to detect + explain + mitigate (and fewer false pages).
The One Diagram That Organizes Everything
Observability becomes much simpler if you treat it like a pipeline:
- User experience (what customers feel)
- Service behavior (what systems do)
- Signals (what you can measure)
- Decisions (what you do when it changes)
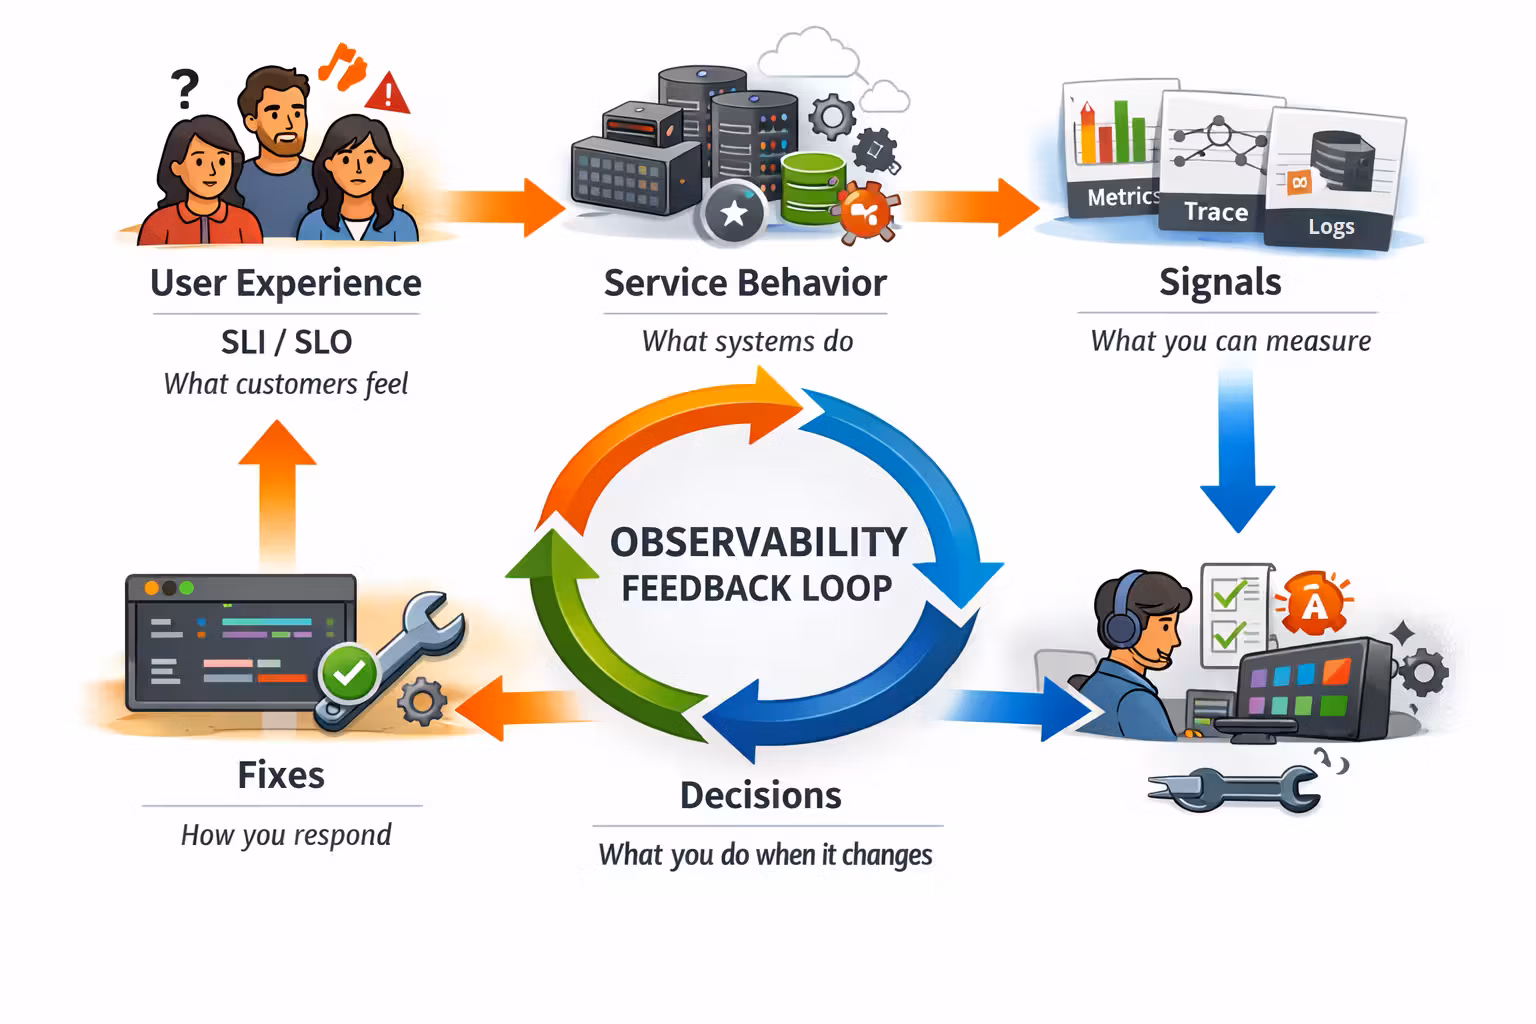
The trick is to stop starting with “what can we measure?”
Start with:
- What do we promise users? (SLO)
- What can break that promise? (failure modes)
- What signals would show it quickly? (logs/metrics/traces)
- What action should a human take? (alerts/playbooks)
Mini-glossary (used in this post)
- SLI (Indicator): a measurement of reliability (latency, error rate, availability, freshness).
- SLO (Objective): the target for an SLI (e.g. “99.9% of requests succeed over 28 days”).
- SLA (Agreement): the contractual promise to customers (usually includes penalties).
In practice: build with SLOs, sell with SLAs.
A good signal is:
- actionable (it changes what you do)
- trustworthy (consistent definitions, stable instrumentation)
- low-noise (doesn’t page you for normal variation)
- correlatable (you can connect it to other signals)
Cardinality is how many unique label combinations a metric can produce.
High-cardinality labels (user_id, request_id, full URL, email) can turn metrics into an unbounded data firehose.
Logs, Metrics, Traces: What Each One Is For
Most teams misuse observability because they treat these as interchangeable.
They’re not.
They’re specialized tools for specialized questions.
Metrics answer “how much?”
Rates, ratios, percentiles, saturation. Great for alerting and trends.
Traces answer “where did the time go?”
A request’s path through services. Great for distributed bottlenecks.
Logs answer “what exactly happened?”
Events and context. Great for forensics, debugging, and audits.
SLOs answer “should we care?”
They define user-impact thresholds and keep you from paging on trivia.
Start With SLO Thinking (Not Tooling)
If you don’t define reliability as experienced by users, you end up alerting on internal noise:
- CPU spikes that don’t hurt anyone
- error logs from retries that succeeded
- “p95 latency” on an endpoint nobody uses
SLOs are how you separate user pain from system gossip.
A practical starting set:
- Availability: “requests succeed” (2xx/3xx vs errors)
- Latency: “requests are fast enough” (percentiles, not averages)
- Correctness / freshness: “the data is right / recent enough” (domain-specific)
- Durability: “we don’t lose writes” (especially for async/event systems)
Example: checkout / purchase / quote bind / claim submit. Everything else can be “nice-to-have” until that journey is operable.
The Golden Signals (and Two Practical Variants)
You want a small set of universal lenses.
Google popularized the “Four Golden Signals” framing: latency, traffic, errors, saturation.
In practice, two variants are especially useful:
- RED method (request-driven services): Rate, Errors, Duration
- USE method (resource-driven systems): Utilization, Saturation, Errors
- Use RED for APIs.
- Use USE for hosts, nodes, databases, and queues.
Metrics: Your Alerting Backbone (If You Do It Right)
Metrics are the best default for:
- detecting user-impact quickly
- seeing blast radius (which region, endpoint, customer segment)
- watching regressions across deploys
- capacity planning
The metric types that matter in practice
- Counters: “how many” (requests_total, errors_total)
- Gauges: “current value” (queue_depth, memory_used)
- Histograms: “distribution” (request_duration_bucket)
If your stack gives you histograms, use them. They’re how you get percentiles you can trust.
The users who complain are living in the tail.Most outages are “tail problems”: the median looks fine while p99 melts.
A default API metric set (good enough to start)
For each service + endpoint:
- request rate
- error rate (by class)
- duration histogram (for p50/p95/p99)
- saturation indicators (CPU, threads, DB connections, queue depth)
Traces: The Only Honest Way to Debug Distributed Latency
Traces are how you answer:
- Which downstream call is slow?
- Is the bottleneck in app code, DB, cache, or a dependency?
- Did latency increase because fan-out increased?
- Are retries amplifying load?
Traces shine when you have:
- microservices
- heavy dependency chains
- multiple data stores
- async boundaries (queues, workflows)
The minimal trace design
- A stable trace id across services
- Context propagation (HTTP headers, messaging metadata)
- Spans around every remote call (DB, cache, HTTP, queue publish)
- Attributes that let you filter safely (endpoint, region, status class, tenant)
- sampling (ideally tail-based)
- sane attribute policies (avoid PII, avoid high-cardinality)
- retention controls
Logs: Your Event Record, Not a Dumpster
Logs are most useful when they’re structured and intentional.
A good log is an event:
- something happened
- in a known context
- with a stable schema
A bad log is “printf debugging in prod.”
The structured logging baseline
- log in JSON (or another structured format)
- include: timestamp, level, service, env, version, request_id, trace_id
- log events, not “I am here” spam
- distinguish expected errors (timeouts, retries) from unexpected bugs
Correlation is the difference between “fast answer” and “guessing.”
Alerts: A Page Is a Contract
If you page humans for non-actionable noise, they will learn to ignore pages.
That’s not a people problem. That’s an architecture problem.
A high-quality alert:
- maps to user impact (SLO burn, error rate on critical path)
- suggests an action (roll back, fail over, mitigate, throttle)
- has a playbook link
- is rate-limited and de-duplicated
Bad alert
“CPU at 85%”
(no user impact, no action, no context)
Good alert
“SLO burn rate indicates 30% of error budget will be consumed in 1 hour for checkout.”
(actionable, user-impact, time-bounded)
Why SLO burn rate alerts are adult supervision
Threshold alerts are fragile.
Burn rate alerts tell you:
- how fast you’re consuming your error budget
- whether this is urgent (fast burn) or slow drift
- how much time you have to respond
That is the difference between “panic” and “control.”
A Practical Incident Workflow (That Doesn’t Lie)
When the page fires, you need a deterministic flow.
Start with user impact (SLO + symptoms)
- Which journey is failing?
- Is this region-specific, tenant-specific, or global?
- Is it error rate or latency tail?
Use metrics to bound the blast radius
- Which endpoint/service is the entry point?
- Did traffic change? Did errors spike? Did duration shift?
- Is saturation rising (DB connections, queue depth, CPU throttling)?
Use traces to localize the bottleneck
- Which dependency got slower?
- Where did retries start?
- Is fan-out or payload size increasing?
Use logs to confirm the mechanism
- What error class? timeout? validation? auth?
- Did a feature flag or rollout change behavior?
- Do you see consistent exceptions with the same signature?
Mitigate, then learn
- rollback / disable feature / reduce load / increase capacity
- capture the timeline: “what we saw → what we did → what worked”
- convert the lesson into instrumentation or a new SLO
The Common Failure Modes of Observability Programs
This is where most teams lose months.
Symptoms:
- dozens of dashboards per service
- nobody knows which one matters
- incidents start with “which graph is the real one?”
Fix:
- define a golden dashboard per critical journey
- everything else is exploratory, not operational
Symptoms:
- metrics bill spikes
- queries slow down
- storage grows without bound
Fix:
- do not label metrics with user_id, request_id, full URL, email
- move high-cardinality detail to logs/traces
- enforce label allowlists
Symptoms:
- pages happen weekly for non-issues
- engineers mute alerts or ignore them
- real incidents take longer to detect
Fix:
- page on SLO impact, not on internal thresholds
- make every page have an owner + playbook
- test alerts during game days
Symptoms:
- logs are noisy and unsearchable
- important events drown in debug spam
- PII appears in logs
Fix:
- log schemas with redaction rules
- separate audit logs vs debug logs
- cap volume and set retention per log class
What “Good” Looks Like (A Quick Checklist)
If you want a crisp definition of “operable,” here it is:
- You have SLOs for critical journeys
- You can detect an SLO breach in minutes
- You can identify the responsible component in < 15 minutes
- You can mitigate (rollback / degrade / throttle) in < 30 minutes
- Post-incident, you add one of:
- better instrumentation
- a better alert
- a better guardrail (rate limiting, circuit breakers, fallbacks)
The point of observability
Not prettier dashboards.
Faster truth under pressure.
Resources
Google SRE — Service Level Objectives (SLIs/SLOs)
A practical entry point for SLO thinking and how to make alerting reflect user impact.
OpenTelemetry (spec + docs)
The modern standard for traces, metrics, logs, and context propagation across services.
FAQ
You need all three eventually, but not all at once.
A practical sequencing:
- metrics + basic alerting on critical journeys
- structured logs with correlation ids
- tracing once fan-out makes latency debugging painful
The priority is: detect user impact fast, then debug fast.
For user experience, p99 often reflects reality better (tail pain).
For stability, p95 can be useful as an early signal.
Best practice: define the percentile in the SLO (what users feel), and alert on burn rate, not raw latency thresholds.
Treating tracing as “free.”
Tracing is a production feature with:
- privacy/security considerations (PII)
- cost controls (sampling, retention)
- schema discipline (attributes, naming, versioning)
If you don’t manage it, you’ll either drown in data or turn it off during the first bill shock.
What’s Next
March was about designing signals that produce truth you can act on.
But observability alone doesn’t keep you safe.
The next month is the other half of operational architecture:
Security for Builders
Because the best incident is the one you prevented — and the second best is the one you can detect and contain quickly.
Security for Builders: Threat Modeling and Secure-by-Default Systems
Security isn’t a checklist you add at the end — it’s a set of architectural constraints. This month is about threat modeling that fits real teams, and defaults that prevent whole classes of incidents.
CI/CD as Architecture: Testing Pyramids, Pipelines, and Rollout Safety
CI/CD isn’t a DevOps checkbox — it’s the architecture that makes change safe. This month is about test economics, pipeline design, and rollout strategies that turn “deploy” into a reversible decision.